Introduction
There is a general perception that Java programs are slow.
•In early versions of Java, you had to struggle hard and compromise a lot to make a Java application run quickly.
•The VM technology and Java development tools have progressed to the point where a Java application is not particularly handicapped.
Software tuning
User experience
• Poor response time
• Need to run faster
Why is it slow?
The virtual machine layer that abstracts Java away from the underlying hardware increases the overhead.
• These overheads can cause Java application to run slower that an equivalent application written in a lower-level language.
• Java's advantages – platform-independence, memory management, powerful exception checking, built-in multi-threading, dynamic resource loading and security checks - add costs.
System limitations
Three resources limits all applications
• CPU speed and availability
• System memory
• Disk (and network) input/output
• The first step in the tuning is to determine which of these is causing your application to run slowly.
• When you fix a bottleneck, is normal that the next bottleneck switch to other limitations.
Why?
There are two major reasons
•The bottleneck
•Bad coding practice
How to make apps run faster?
Bottleneck is un-avoidable
• Better programming practice can be a sure solution
• Good design
• Good coding practice
Before we begin…
Java application normally runs fast enough
• So, the tuning game comes to play
• Have a strategy
Tuning strategy
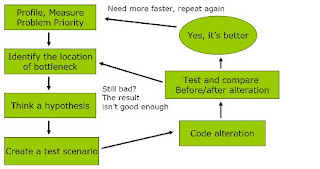
Identify the bottleneck
Perceived Performance
The user has a particular view of performance that allows you to cut some corners.
• Ex : A browser that gives a running countdown of the amount left to be downloaded from a server is seen to be faster that one that just sits here until all the data is downloaded.
• Rules:
•if application is unresponsive for more than 2 sec, it is seem as slow.
•Users are not aware of response time improvements of less than 20 %
How to appear quicker?
Threading: ensuring that your application remains responsive to the user, even while it is executing some other function.
•Streaming: display a partial result of the activity while continuing to compile more results in background. (very useful in distributed systems).
Caching: the caching technique help you to speed the data access. The read-ahead algorithm use in disk hardware is fast when you reading forward through a file.
Starting to tune
User agreements: you should agree with your users what the performance of the applications is expected to be: response times, system wide throughput, max number of users, data,
•Setting benchmarks: these are precise specifications stating what part of code needs to run in what amount of time.
How much faster and in which parts, and for how much effort ?
Without clear performance objectives, tuning will never be completed
Taking Measurements
Each run of your benchmarks needs to be under conditions that are identical as possible.
• The benchmark should be run multiples times, and the full list of results retained, not just the average and deviation.
• Run a initial benchmark to specify how far you need to go and highlight how much you have achieved when you finish tuning.
• Make your benchmark long enough (over 5 sec)
What to measure?
Main: the wall-clock time (System.currentTimeMillis ())
•CPU time: time allocated on the CPU for a particular procedure
•Memory size
•Disk throughput
•Network traffic, throughput, and latency
Note:à Java doesn't provide mechanisms for measuring theses values directly.
Profiling Tools: Measurements and timings
•Garbage collection
•Method calls
•Object-creation profiling
•Monitoring gross memory usage
Measurements and Timings
Any profiler slow down the application it is profiling.
•Using currentTimeMillis () is the only reliable way.
•The OS interfere with the results by the allocation of different priorities to the process.
•On certain OS, the foreground processes are given maximum priority.
•Some cache effects can lead to wrong result.
Garbage Collection
Some of the commercial profilers provide statistics showing what the garbage collector is doing.
•Or use the -verbose option with the VM.
•With VM1.4: java -Xloggc:
•The printout includes explicit synchronous calls to the garbage collector and asynchronous executions of the garbage collector when free memory available gets low.
The important items that all -verbosegc output are
•the size of the heap after garbage collection
•the time taken to run the garbage collection
•the number of bytes reclaimed by the garbage collection.
•Interesting value:
•Cost of GC to your application (percentage)
•Cost of the GC in the application's processing time
Object creation profiling
Determine object numbers
•Identifying where particular objects are created in the code.
•The JDK provides very rudimentary object creation statistics.
•Use a commercial tool in place of the SDK.
Monitoring Gross Memory Usage
The JDK provides two methods for monitoring the amount of memory used by the runtime system :
•total Memory () and free Memory () in the java.lang.Runtime class.
•total Memory () returns a long, which is the number of bytes currently allocated to the runtime system for this particular VM process.
•free Memory () returns a long, which is the number of bytes available to the VM to create objects from the section of memory it controls.
Tools
Commercial
•Optimizeit from Borland
•JProbe from Quest Software
•JProfiler from ej-technologies
•WebSphere Studio from IBM
•Free
•HPjmeter from Hewlett-Packard
•HPjtune
How to measure the software performance?
Using profilers
•Profiler is a programming tool that can crack the performance of another computer program
•Two common usages
•Profile an application performance
•Monitor application memory usage
Open source profile
NetBeans built-in profiler http://profiler.netbeans.org/
remaining information next post please read all other wise no use.


No comments:
Post a Comment